Site down

Understand the Problem

Start with a Few Quick Questions

When a site goes down, it can feel urgent, but a step-by-step approach often reveals the problem quickly. Here’s a simple guide to help you troubleshoot and bring the site back online.

These initial questions can save you time by narrowing down the possible causes:

  • Did they recently deploy code? New code can sometimes introduce errors, missing dependencies, or conflicts that cause downtime.
  • Was there an upgrade? Major upgrades especially can cause “Bootfailed” errors due to compatibility issues.
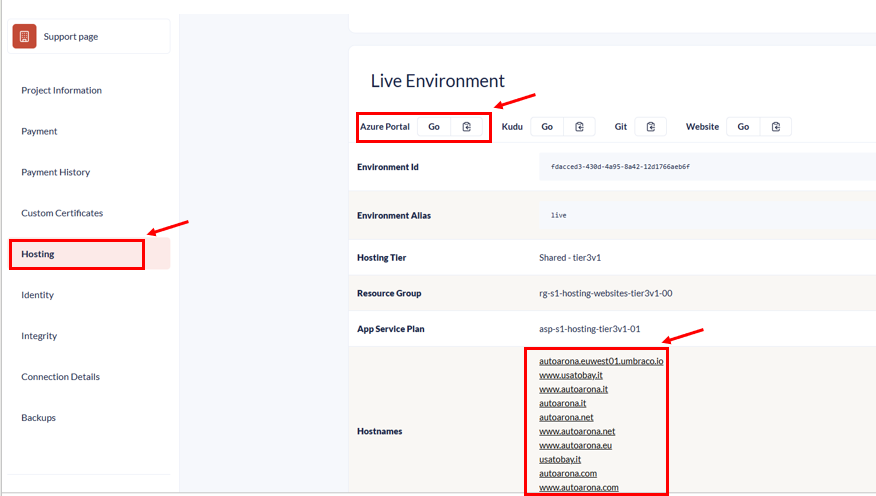
  • Which environment is affected? Knowing if it’s Dev, Staging, or Production helps clarify the scope of the issue—especially if hostnames are only on Dev or specific setups are only on Prod.

Restart the environment

Restart the environment

Sometimes, the simplest fix is a restart. Ask the customer to restart or do it yourself if you can. A quick restart often resolves minor issues related to configuration or resource usage and can give a good sense of whether the problem is serious or temporary.

Use Azure’s Diagnostic Tools

Web App Down

If a restart didn’t do the trick, dig into Azure’s diagnostic tools:

  • First check the hostnames to see what type of error you get. See if this offers you any clues. You can find the hostnames either on the Portal if you are invited or on the: https://www.s1.umbraco.io/projectsupport/project-name/information page. 
  • Here you can also find the link to the Azure App Service plan where you can find more information about CPU, Memory usage, etc. Click on the Azure Portal GO:

  • Go to Diagnose and Solve Problems (Diagnose and solve problems -> Availability and Performance -> WebApp Down): In this section you can check for known availability or performance issues and can often pinpoint if the app is down due to a resource problem.
  • See image below to see where you can find this:

  • Note the Downtime is shown in UTC: Tracking the exact time of the outage is critical, as it helps correlate events across logs and alerts. Azure logs are timestamped in UTC, so keep this in mind when comparing with local time.

High resource utilization can lead to restarts or degraded performance. Here are specific areas to inspect:

  • CPU and Memory Usage: Excessive CPU or memory usage can result in limited resources for the environment which in turn can result in a downtime period. 
  • Be sure to check if Azure has restarted the App Service Plan—this can show up under the Downtime graph or in the Web App Restarted logs. You might see terms like "Cold Boot" or "Warm Boot" here, which indicate the type of restart.
  • Check if any other project overuses the resources that usually appear in High CPU Analysis or Memory Analysis. If so, please follow up on the Noisy Neighbour guide to handle it as this can help regain resources for the project which is experiencing the issues. 

Overall Usage of Resources

High CPU or memory usage can sometimes cause slowness or even trigger restarts. To help you troubleshoot, here are a few things to check:

  • CPU and Memory Usage: When these reach their limits, it can impact performance or lead to temporary downtime.
  • Where to Check: Go to the App Service Plan to review your usage. This view includes all resources used by environments on the plan, which is especially helpful if your project shares a plan with others.

Tip

Be sure to adjust your settings to view the Max CPU Percentage and Max Memory instead of the default averages—this gives you a clearer picture of peak usage.

Using max for CPU and memory helps you see the highest points of resource usage rather than the average, which smooths out peaks and may miss critical spikes. High CPU or memory spikes, even if brief, can strain your system and lead to performance issues or restarts, especially in shared environments. By checking the max values, you can identify these resource peaks and address them proactively before they impact performance.

Check the DTU

Check for any DTU (Database Transaction Unit) spikes, as these can also lead to downtime.

  • DTU Spikes: DTU usage indicates how intensively the database is being used. When DTU usage reaches 100%, it can overwhelm the database, potentially causing slowdowns or even downtime.
  • Why This Matters: High DTU usage is especially critical to monitor if recent code changes might contain a loop or repeated calls that excessively access the database. These situations can push DTU usage to its limit, leading to performance issues and possible outages.
  • You can check the DTU by copying the database from the Connection details under the affected environment, and paste it on Azure:

Here you can observe if the DTU is maxing out. If that's the case, you may have found the culprit.

One example is the image below. Here the customer has push a custom code implementations which resulted in maxed out DTU. Reverting the changes locally and pushing the changes from the left most environment to the Live environment fixed the issue:

Check the Application Event Log

  • Azure logs warnings or errors here, so check for messages about resource limits or crashes. 
  • You can find the logs by checking this section shown in the image below:

Here you can see multiple processes logged in. Check to see if any useful information is presented here:

Application Insights on Azure

Another useful tool for troubleshooting is Application Insights on Azure. To get started, use the environment ID and paste it into the search window here: Azure Application Insights.

In Application Insights, you can explore various event types. Exceptions and traces are usually the most relevant for identifying issues. Check these events to see if any details point to the cause of the downtime.

Check Availabilty and Performance on the Portal

It’s important to check if the environment might have exceeded the resource limits set by the plan.

When resource usage goes over the limit for more than 5 minutes, the environment may automatically restart to reduce resource consumption and prevent impact on other projects. This can occasionally cause delays in bringing the environment back online, which helps explain any brief downtime periods customers may have noticed.


You can read more about this here:

Check the Logs

Logs

Logs are your best friend here, so give them a good look:

  • Backoffice or KUDU Logs: Try checking logs through the portal or the backoffice first. If it’s not accessible, KUDU  gives you direct access to log files.
  • Elmah.io Stack Trace Formatter: This tool helps make stack traces easier to read, so you can spot the line of code where the issue occurred. Great for when logs get long!

Test Locally (if all else fails)

Clone down the project

If none of the above revealed the issue, you can download the project locally for more detailed testing:

  • Clone and Run Locally: This lets you troubleshoot code errors that might not be obvious from Azure logs.
  • Check for Code Errors: Running it locally can help pinpoint issues in the code that might not be apparent in the cloud environment.

Checklist: Steps to Troubleshoot a Down Umbraco Site

  1. Ask Questions
  2. Restart the Environment
  3. Use Azure Diagnostics
    • Look into “Diagnose and Solve Problems” for availability/performance.
    • Check Web App Restarted logs
  4. Check Resource Usage on the entire App Service plan
    • CPU and memory usage.
    • Application Event Log.
    • DTU spikes (consider copying the DB for further testing).
    • Check the Application Insights on Azure.
    • Check the Availabilty and performance on the Umbraco Portal.
  5. Analyze Logs
    • Backoffice or KUDU logs.
    • Format stack traces with Elmah.io.
  6. Test Locally (if needed)
    • Clone and run the project locally.
    • Review any code errors locally.

Check Cloudflare

Cloudflare

In some cases, you may not find anything in the above-mentioned steps. For these cases, one last thing you can check to see if there have been any suspicious spikes in the Request, Views, and so on. 

To check this please go to the Cloudflare website (https://www.cloudflare.com/) and check the hostnames specified on the Portal  - Configuration - Hostnames.

This is part of our standard investigation since an increase in Request, Views and so on can result in an increase in the overall resources used by the project such as CPU and memory which in turn can result in a downtime period for the customer. 

If you or the customer notice that for example, there is a suspicious IP address and you suspect a DDoS attack ....