Table of Contents

Cloudflare

Cloudflare Reports

Generating Cloudflare Reports

We currently have access to Cloudflare, which allows us to generate analytics and log reports for customers. However, there are a few important limitations to keep in mind:

  • Reports can only include data from the last 3 months.

  • Each individual report can only cover a maximum of 30 days.

If a customer requests data for the past 3 months, you will need to generate one report per month.

Step-by-Step Guide to Generating Reports

1. Log in to Cloudflare

Go to https://www.cloudflare.com/ and log in using your email and password.

2. Select the Umbraco Account

Once logged in, choose the Umbraco account.

3. Choose the umbraco.io:

From the available list, select umbraco.io.

4. Access Analytics and Logs

On the left-hand menu, click on Analytics & Logs.

Important

 Avoid clicking other menu items to prevent unintentional changes.

5. Apply a Hostname Filter

To view data for a specific hostname, create a filter:

  • Choose either contains or equals.

  • Contains is ideal when the domain has multiple associated subdomains.

  • Equals is best if you want to focus on one specific domain.

Then, input the hostname you wish to report on.

6. Select a Date Range

You can select from several pre-set time ranges or use custom dates for specific needs.

7. Customize Displayed Data

To give customers more insights, increase the number of displayed items from the default 5 to 15.

8. Downloading the Report

To save or share the report, click on the “Print report” button located in the upper-right corner of the screen.

Understanding the Key Report Metrics

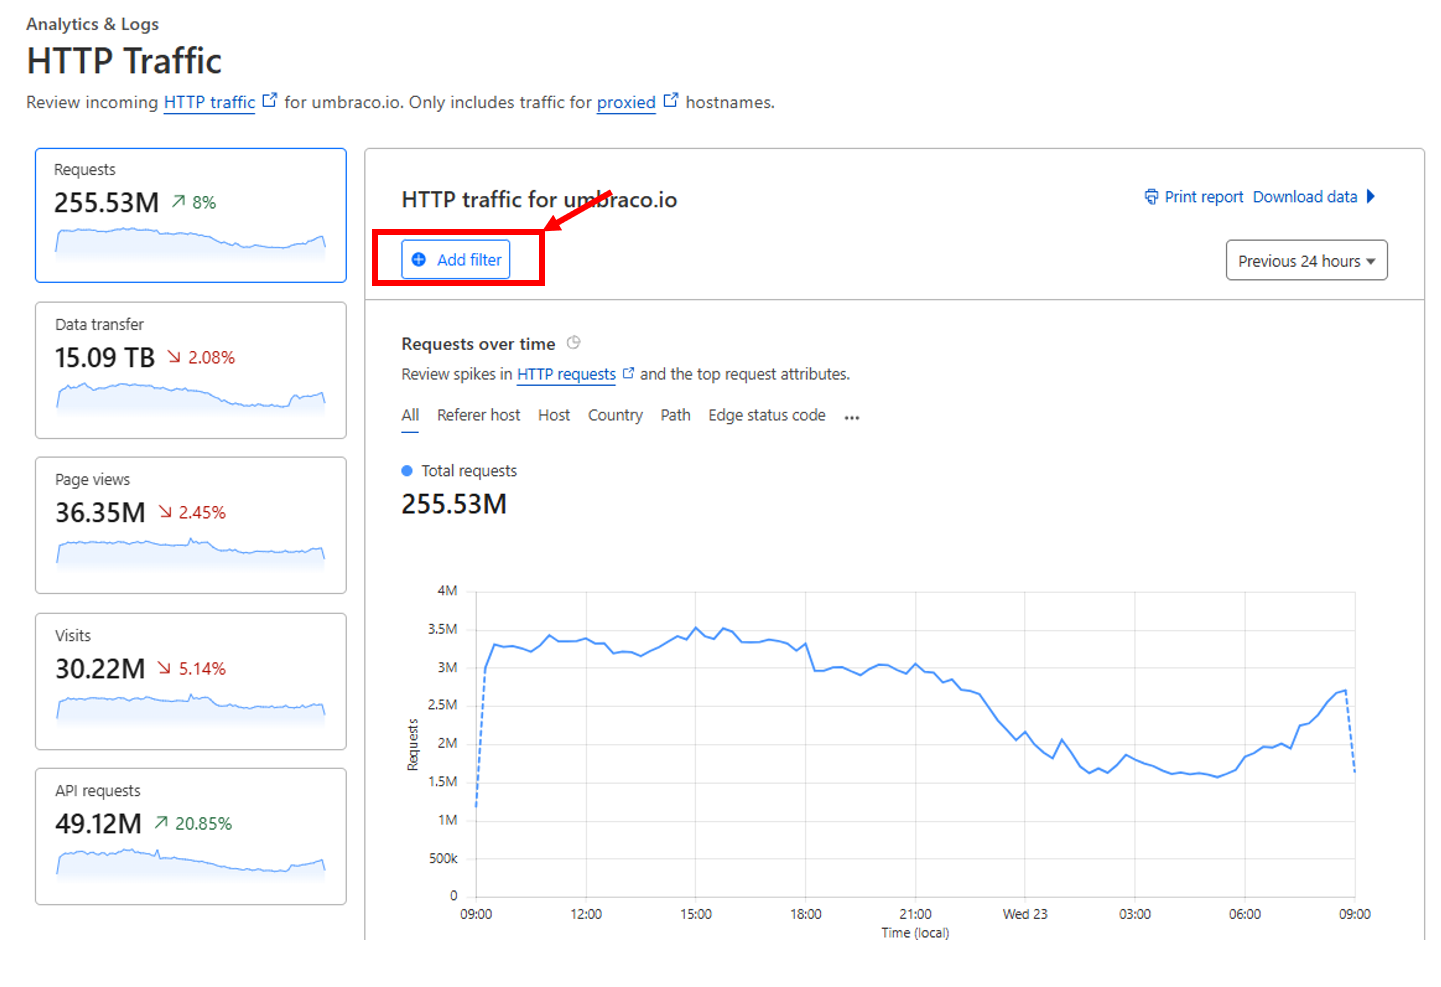
Once you apply the filters and generate a report, you’ll see a set of key metrics that give insights into traffic and performance. Here’s a quick overview of each metric:
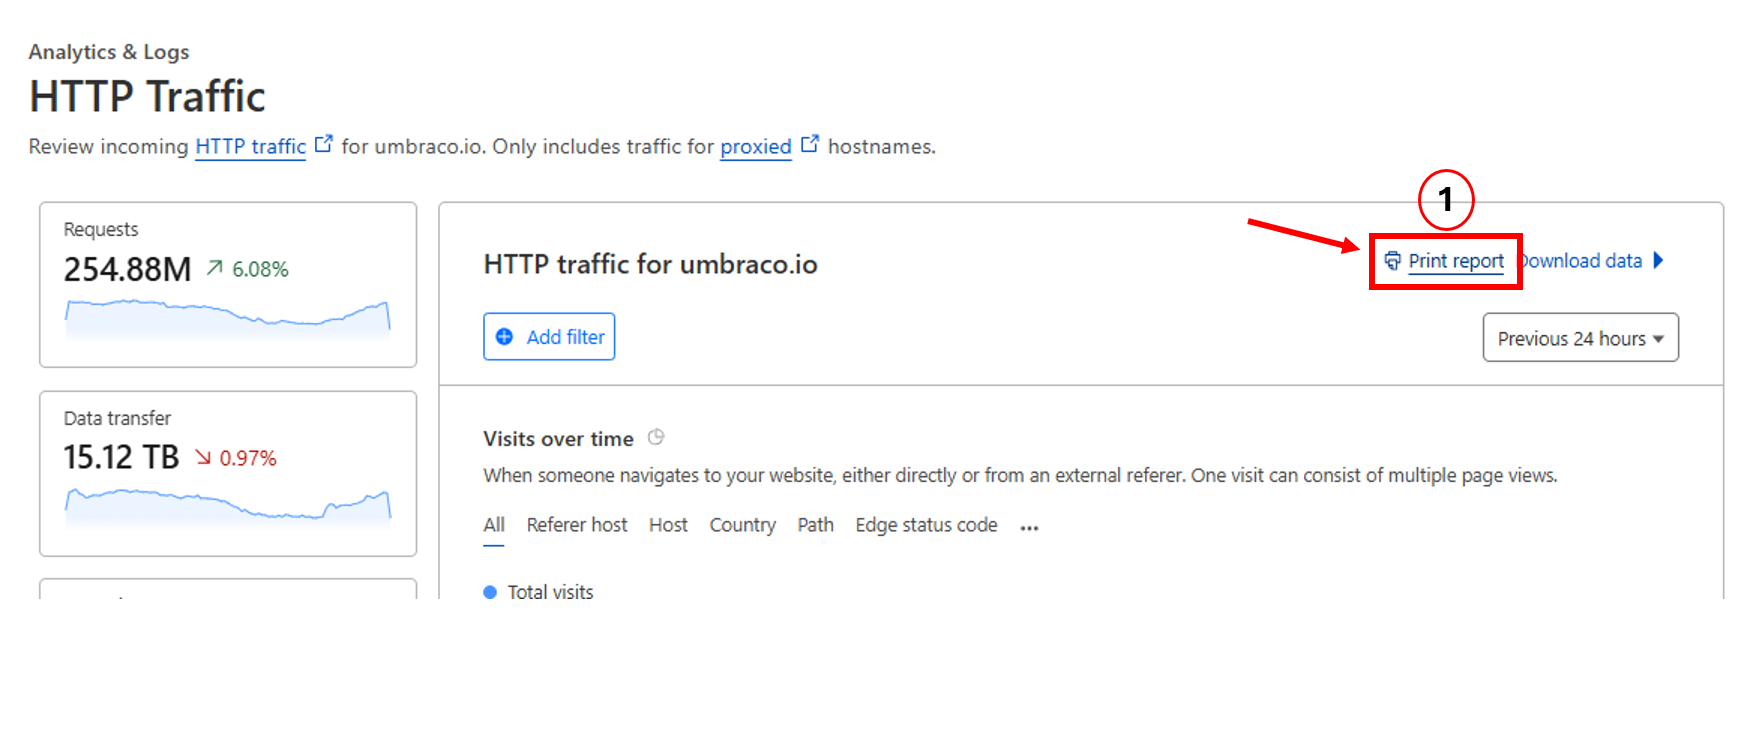
1. Requests

What it shows:
The total number of HTTP/HTTPS requests made to the website during the selected period. This includes all file types: HTML, CSS, JavaScript, images, etc.

Why it’s useful:
This gives an overall idea of how much activity your site is handling. A spike or drop could indicate a marketing campaign, bot traffic, or a performance issue.

2. Data Transfer

What it shows:
The total amount of data transferred from Cloudflare to the clients (end users). Measured in terabytes (TB).

Why it’s useful:
High data transfer may indicate large file sizes or high traffic. It can help identify optimization opportunities (e.g., compressing images or minifying files).

3. Page Views

What it shows:
The number of times pages were viewed by users. Unlike requests, which count all resources, this metric focuses on full-page loads.

Why it’s useful:
Page views are helpful for measuring user engagement and understanding how often your actual content is being accessed.

4. Visits

What it shows:
A "visit" typically starts when a user arrives on your website and ends after a period of inactivity or when the session expires.

Why it’s useful:
Visits give a more refined picture of user sessions and behavior. This metric is especially useful for marketing and performance analysis.

Analytics Categories in Cloudflare Reports

1. Referrers

  • Description: Lists the websites that directed traffic to your site.

  • Why It Matters: Helps you understand which external sources are driving visits. Useful for marketing performance and identifying valuable partnerships.

2. Paths

  • Description: Shows the most accessed URL paths on your site.

  • Why It Matters: Reveals popular pages, broken links, etc. 

3. Hosts

  • Description: Displays which hostnames (subdomains or domains) are receiving traffic.

  • Why It Matters: Essential for multi-domain environments. Helps you analyze traffic split across hostnames.

4. Source Browsers

  • Description: Breaks down the browsers visitors used to access your site.

  • Why It Matters: Ensures compatibility across major browsers and highlights browser-specific issues, we will not necessarily use this.

5. Source Device Types

  • Description: Classifies traffic by device: desktop, mobile, or tablet.

  • Why It Matters: Guides design choices, testing priorities, and user experience enhancements based on device usage trends. Once again, not necessarily used but it can help highlight a pattern. 

6. Source Operating Systems

  • Description: Displays the operating systems of visitors (Windows, iOS, Android, etc.).

  • Why It Matters: Helpful in identifying OS-specific bugs by looking at the most-used systems.

7. Source ASNs

  • Description: Lists the Autonomous System Numbers (ASNs), essentially the ISPs or corporate networks that users are coming from.

  • Why It Matters: Helps detect patterns such as attacks from specific providers or corporate access.

8. Source User Agents

  • Description: Shows detailed user-agent strings for browsers, bots, or tools.

  • Why It Matters: Identifies bot traffic, scrapers, or unexpected clients accessing your site.

9. Data Centers

  • Description: Shows which Cloudflare data centers served your traffic.

  • Why It Matters: Useful for understanding global reach and performance. Can help identify regional delays or load balancing issues.

10. Edge Status Codes

  • Description: HTTP status codes returned from Cloudflare's edge servers.

  • Why It Matters: Tracks error rates (e.g., 404s), redirects, and successful requests. Useful for debugging and traffic flow analysis.

11. Source IPs

  • Description: Displays the IP addresses responsible for the most traffic.

  • Why It Matters: Helps identify abusive IPs, bots, or unexpected high-traffic clients.

12. HTTP Versions

  • Description: Indicates the version of HTTP used by clients (HTTP/1.1, HTTP/2, HTTP/3).

  • Why It Matters: Reflects performance optimizations (e.g., HTTP/3 is faster). Also highlights if clients support newer protocols.

13. Cache Statuses

  • Description: Shows how responses were served: from cache (Hit), not cached (Miss), expired, or dynamic.

  • Why It Matters: Indicates caching effectiveness. High cache hits improve performance and reduce origin load.

14. X-Requested-With Headers

  • Description: Lists custom headers used in requests, often tied to frameworks or APIs (like XMLHttpRequest)

  • Why It Matters: Helps identify AJAX traffic, third-party tools, or suspicious/malicious requests.