Azure

How to Stop and Start an Application in Azure

Introduction

There are times when you need to completely stop and restart an application in Azure, particularly when a simple restart via the Umbraco portal does not resolve the issue. The key difference between a basic restart and a full stop-and-start process is that stopping the application entirely ensures that no background processes remain active, providing a fresh restart.

This guide outlines the steps needed to stop and start an application in Azure. Before proceeding, ensure you have the required access permissions.

Step 1: Identify the Environment

  1. Navigate to the /status page using the following URL:

    • https://www.s1.umbraco.io/projectsupport/project-name/hosting

  2. Identify the environment you need to stop and start.

  3. Open Azure, and navigate to the specific environment.

Step 2: Gain Access Permissions

To perform this action, you must first ensure you have the correct role assigned.

  1. In the Azure portal, click on Access Control (IAM).
  2. Select View My Access.

  1. A pop-up window will open. Click on Eligible Assignments.
  2. Click on Contributor, then select Activate Role.

  1. Another pop-up will appear asking for justification. Provide a clear reason, such as:
    • “Site down, attempting to stop and start the application to restore functionality.”
  2. Click Activate.

  1. Wait until all stages display a green checkmark.
  2. You will receive a notification confirming that the Contributor role has been successfully activated.

Step 3: Stop the Application

  1. Once your access has been activated, navigate to Overview.
  2. Click on Stop.
  3. A confirmation pop-up will appear—confirm the action.

  1. Navigate to the project’s domain. You will now see a 403 Error Page along with a blue screen indicating that the application has been stopped.

Step 4: Start the Application

  1. In the Azure portal, click on Start to restart the application.

Important

Do not touch any unnecessary buttons while having the Contributor role activated.

Checking Database Performance in Azure

General

In some cases, users may experience performance issues with their back office or site. If the Database Transaction Unit (DTU) is maxed out, but you are unable to identify the specific queries causing the issue due to lack of permissions, follow these steps to gain access and troubleshoot.

Step 1: Locate the Database

  1. Navigate to the Azure portal and go to the Project > Configuration > Connections.
  2. Identify the environment for which you want to check the database.
  3. Copy the database name.

  1. Go to Azure Portal and paste the database name in the search bar.

Step 2: Gain Access to Query Performance Insights

  1. Navigate to Intelligent Performance > Query Performance Insight.
  2. A graph will display multiple queries along with CPU usage data.

  1. If you attempt to click on a query, but an error states that you do not have access, follow the next steps to gain necessary permissions.

Step 3: Obtain Contributor Access

  1. Return to the Overview section.
  2. Click on the Resource Group associated with the database.

Now click on the Click here as shown in the image below:

Click on Access Control (IAM) > View My Access.

  1. A pop-up window will appear. Click on Eligible Assignments.
  2. Click on Contributor, then select Activate Role.

  1. Another pop-up will appear asking for justification. Provide a clear reason, such as:
    • “Investigating database performance issues related to high CPU usage.”
  2. Click Activate.

  1. Wait until all stages display a green checkmark.
  2. You will receive a notification confirming that the Contributor role has been successfully activated.

Step 4: View Query Performance Details

  1. Return to Intelligent Performance > Query Performance Insight.
  2. Click on the query with the highest CPU consumption.

3. You will now be able to view query details without the previous access restriction.

Azure events & downtime investigation

Site down investigation - Azure maintenance, platform upgrade, auto-healing or recycling

Sometimes a site goes down or experiences a very weird behaviour like:
- Not receiving an autoupgrade
- Examine Indexes failing to create and getting corrupted
- Some service stops running or experiences interruptions
- Cold/Warm boots
- Performance goes haywire 

While there could be many various reasons why this happens, one common reason is that an Azure event has happened on the app service plan (server) and caused irregularities and disruptions.

This will be a guide on how to check if such an Event has happened.

We’ll have as an example an actual Umbraco Cloud project that went down and experienced downtime because of these events

This project is called: Horeca Vlaanderen - Erkend Friturist

Let’s start the investigation.


1. First step will be going to Azure on the environment where the issue happened

Go to Azure

2. Diagnose and solve problems > Availability and performance

Diagnose and solve problems - Availabilty and performance

3. Under Web app down you’ll see irregularities, spikes and downtime - this will indicate that something actually happened with the web application (specific cloud environment).

You’ll also be able to see that the Organic SLA is not perfect 100% which means that the site did go down or experienced performance issues.

Web app down

4. Next, we’ll want to check what happened and why do we see downtime and for that one of the best places to check will be Web App Slow.

Web app slow

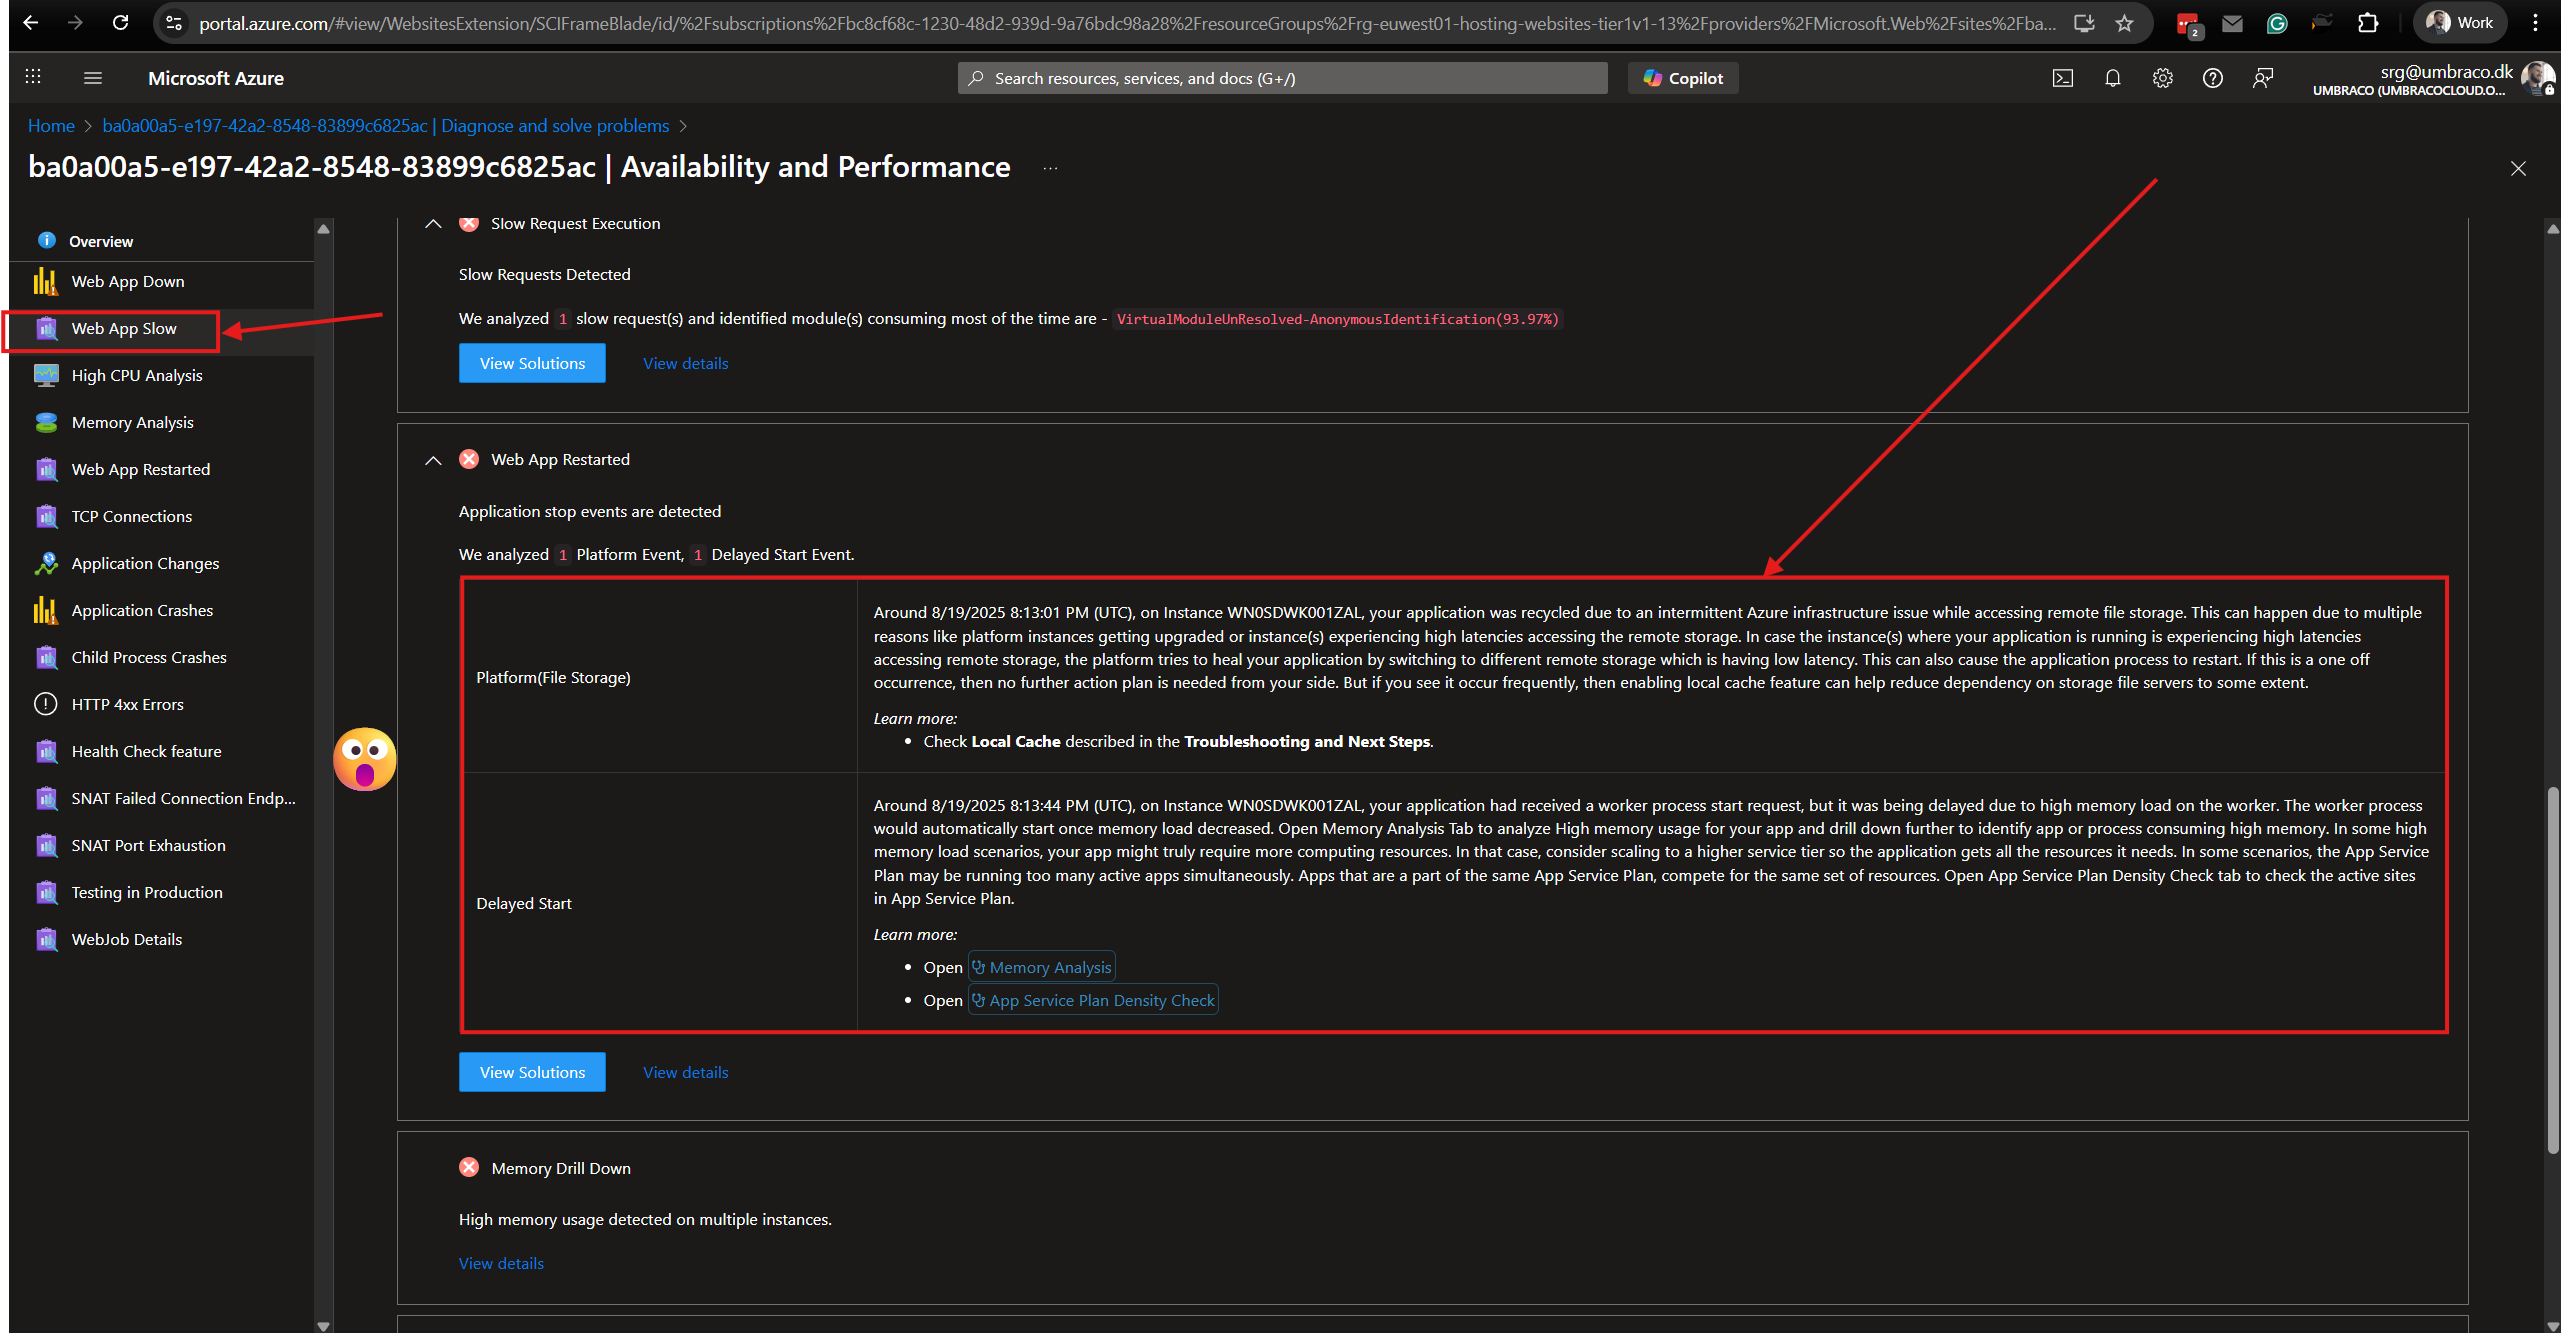
Now we can see what happened. We have two different events.

-
Platform(File Storage)
This means that the server had trouble talking to its storage (like a shared hard drive in the cloud). To fix it, Azure automatically restarted the application on a healthier connection. This restart is called a "recycle."

For an Umbraco Cloud project, this can mean:

  • The site might briefly restart, causing a short outage or slow response.

  • The site might experience a cold boot, meaning that the site starts up from scratch (like turning on a computer that was fully shut down). This usually takes longer because the app needs to load everything fresh into memory.
    However, if a restart is performed the Umbraco project enters a weird state where it requires to be restarted before it starts working again - this is something that is happening constantly on Umbraco Cloud.

- Delayed Start
This means that the Umbraco Cloud site didn’t start right away after a restart — the platform waited before bringing it fully online.

This can happen if Azure is managing resources, applying updates, or ensuring storage/services are ready.


Conclusion

Based on these events we clearly can determine that something has actually happened on the app service plan that has caused disruptions and it is safe to share these events with the customer explaining what happened.

What exactly do we tell the customer though?

Well, we have to be transparent and honest.
Azure has performed some events that we are not in control, that have caused the disruptions they have experienced.
We then can share screenshots of the events that happened

Azure events

How can we prevent this from happening?
In short, we can’t. Umbraco is not in control of these Azure events however, most of the times these events come with the CPU usage on the entire app service plan (server) maxing out, causing resource exhaustion. During the exhausted period, the site can fail from multiple places like Indexes, NuCache, Services etc.
Based on this, we can definitely suggest that if their website is a critical website, moving on
dedicated resources would be a very smart idea.
Additionally, we are working on improving the behaviour of an Umbraco website on Umbraco Cloud when these events happen so hopefully in the future it will be handled better.

Note

Do note that: even if these events start at a specific time, they can last for a longer period of time. This is just in case the timestamps of when the customer noticed their site going down and the Azure events don’t match.